

2.28.25 Tredas Weekly Recap
Weekly Action:
May25 Corn down 35c at $4.69
May25 Beans down 32c at $10.25
May25 KC Wheat down 48c at $5.73
April25 Hogs down 4.000 at $83.675
April25 Fats down 1.300 at $192.650
March25 Feeders up 7.025 at $274.975
Dec25 Corn down 20c at $4.54
Nov25 Beans down 31c at $10.28
July25 KC Wheat down 48c at $5.85
We are 100% through the crop insurance pricing window.
Corn $4.71
Soybeans $10.55
Grains:
After almost an 80c rally since Thanksgiving, the corn market took it on the chin with our loss of momentum and breaking key support levels throughout the week on the May contract. Our 20-day moving average (purple line at 5.03) failed us right out of the gate on Monday and to close the week, we traded through our 50dma (light blue line at 4.84) finishing at 4.69. Next levels of support on the May contract would be our 100dma (pink line at 4.62) and 200dma (yellow line at 4.57).

Bean complex also had a lower trade on the week with Brazil prices being well below the US and plentiful newly harvested beans coming to market. Speculators seemed to have exited positions aggressively over the last 7 sessions as open interest has fallen nearly 125k contracts.
Price direction moving forward will be tied to weather and policy from Trump.
USDA AG Outlook Conference Recap:
Cliff notes of the next couple paragraphs…
USDA projects corn acres to reach 94 million acres, up 3.8% year-over-year. Which figured on 181.0 forecasted yield would land us at a record large 15.6-billion-bushel corn crop.
Soybean planted acres are estimated to be 84 million, down 3.6% year over year, which using a 52.5bu yield, would land us the 4th largest soybean crop grown on record at 4.4 billion bushels.
Wheat acres projected at 47 million, up 2% vs 2024.
Full comments from RJO’s Randy Mittelstaedt…
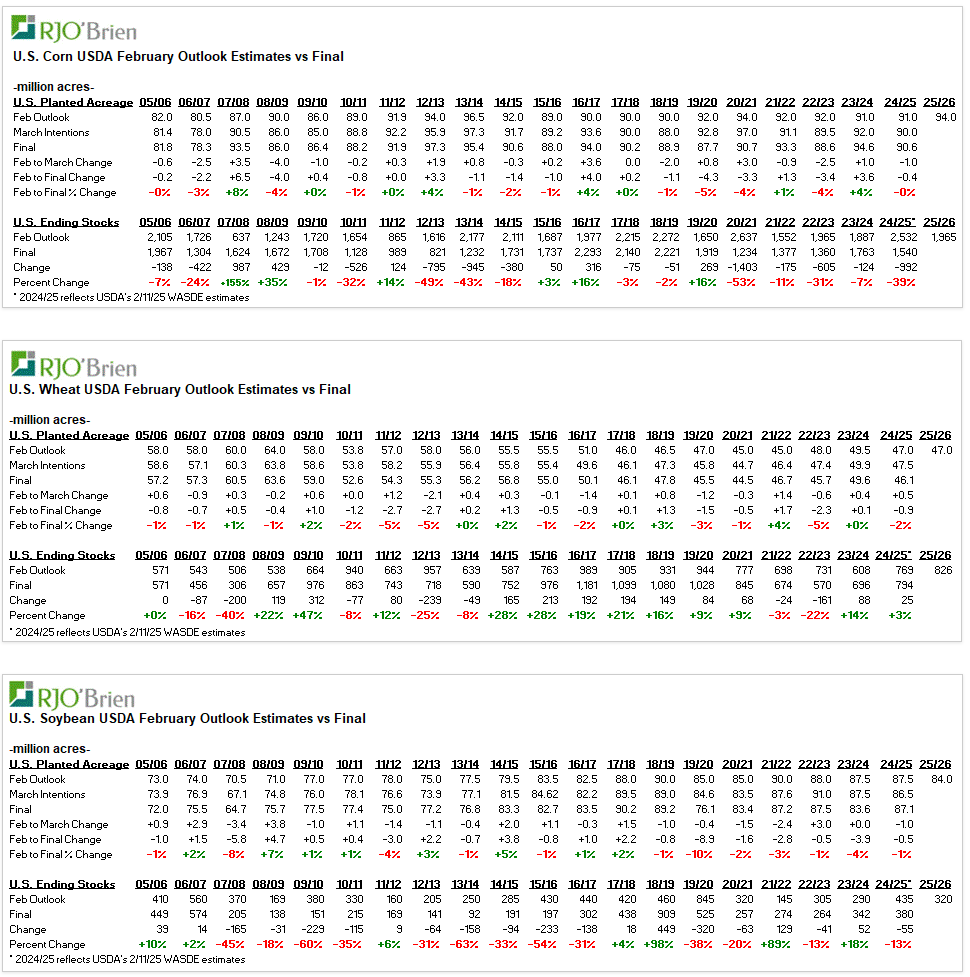
“Initial 2025/26 acreage ideas by USDA indicate expectations for total acreage among corn, wheat and soybeans combined to be 225.0 million acres vs last year’s 223.7 million, while cotton area is expected to decline to 10.0 million acres from last year’s 11.182 million. The sum of average wire service survey estimates for corn, wheat and soybean area was 224.7 million acres. Initial USDA corn acreage ideas were put at 94.0 million acres vs 90.594 million last year and compares to the 92.0 million acres USDA showed in their previously-released baseline projections. A wire service survey ahead of today’s numbers put the average expectation for corn planted area at 93.6 million acres (92.0-95.0 million range of ideas). USDA looks for soybean acreage at 84.0 mil acres vs 87.050 mil last year and compares to the 85.0 mil they penciled in their baseline projections. Average market expectations were put at 84.4 million acres (83.1-86.5 million range). All wheat planted area is seen at 47.0 mil acres by USDA vs 46.079 mil last year and the baseline balance sheet putting this year’s acreage at 46.0 million, while average market expectations were 46.7 million (46.0-47.9 million range). Based on the USDA’s January Winter Wheat Seedings report estimate of 34.115 million acres, USDA’s total spring wheat (other spring + durum) acreage assumption would be 12.885 million acres vs last year’s 12.689 million.
As seen in the tables below, final corn planted area has been below the USDA’s February assumption in 6 of the last 10 years and above in 4 of the last 10 years, while actual soybean planted area has been below the USDA’s February assumption in each of the last 7 years and in 8 of the last 10 years. Actual all wheat planted was below the USDA’s February assumption in 6 of the last 10 years, above in 2 of the last 10 years and right in line with the Feb assumption in 2 of the last 10 years.
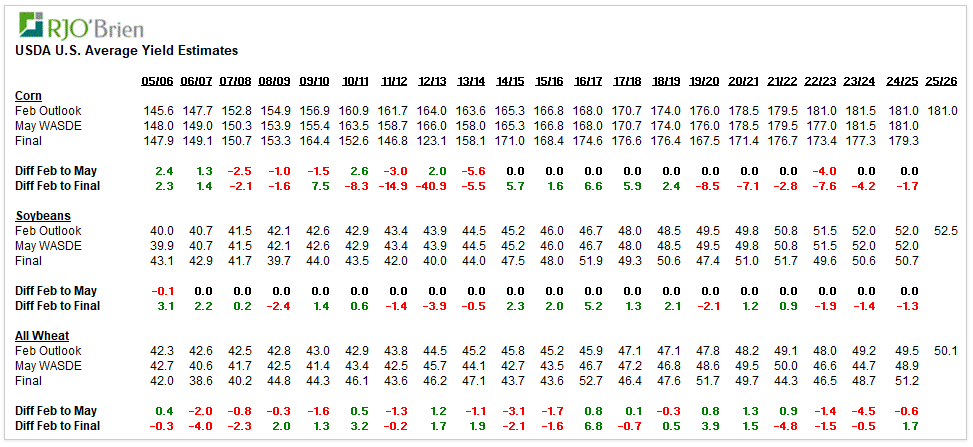
U.S. corn ending stocks have proven lower than the USDA's February estimates each of the last 5 years and in 7 of the last 8 years, including their current 2024/25 ending stocks estimate of 1.540 billion bushels which is well below last year’s Outlook Forum idea at 2.532 billion bushels. Today, the USDA preliminarily estimated 2025/26 U.S. corn ending stocks at 1.965 billion bushels, up 425 million bushels from this year and compares to wire service-reported average expectations of 1.910 billion bushels (1.621-2.180 billion range of ideas). The USDA is starting the 2025/26 marketing year with an estimated yield of 181.0 bushels/acre, what would be a new record with anything above 2024/25’s 179.3 bushels/acre. Additionally, each of the last six years’ crops have seen yields prove below USDA’s initial ideas in February, averaging a 5.3 bu/acre downside deviation from the February assumption. We’re using a starting point yield of 180.0 bushels/acre given the relatively disappointing yield performances in recent years.
Final U.S. soybean ending stocks have been heavily biased towards being lower than the USDA's February estimates, having been the case in 13 of the last 18 years, including the USDA’s current 2024/25 ending stocks estimate of 380 million bushels being below their February assumption last year of 435 million. USDA put their early ideas of 2025/26 U.S. soybean ending stocks today at 320 million bushels vs wire service-reported average expectations of 380 million bushels (282-434 million range). In recent years, the U.S. soybean average yield has proven below USDA’s February ideas in each of the last three years, by an average of 1.5 bu/acre, but over the last 11 years, the final soybean yield proved above USDA’s February ideas in 7 of those years. USDA put their early 2025/26 U.S. soybean yield ideas at 52.5 bushels/acre, while we’re more comfortable starting our new crop ideas at 51.2 bu/acre given the disappointing yield performances in recent years.
The USDA estimated 2025/26 U.S. wheat ending stocks today at 826 million bushels vs their current estimate of 2024/25 ending stocks of 794 million bushels and wire service-reported average expectations of 830 million bushels (802-890 million range). U.S. wheat ending stocks have had a considerable bias for proving higher than the USDA’s February assumption, having been the case in 9 of the last 11 years, inclusive of current 2024/25 ideas which are slightly above USDA’s February ideas last year of 769 million bushels.”
Livestock:
April live cattle prices hit a 2-week high yesterday and the upside correction from the sharp sell off move from late January seemed to be in tack until hitting our head (resistance) in the 196.500 area. Live cattle open interest rose nearly 2k contracts on Thursday’s rally. Tariffs will be the main focus next week which may add to the volatility.
April hogs tripped and fell on their face right to the 200dma (84.185) during Thursday’s trading session after a short positive Wednesday but ultimately broke through that support to close out the week. Traders were hoping a deal could be reached before Tuesday’s deadline for tariffs to take effect, but time is running out on that idea.
Weather:
Over the next 5 days, moisture will increase in the easter corn belt, including eastern KS and MO but the western Plains will remain dry. The 6-10 day outlook shows above normal temps and below normal precipitation, while the 8-14 day keeps the warmer temps in place but returns precipitation to normal levels.

The South American forecast has trended wetter in central Brazil in the 11-15 day outlook while key areas of central Argentina trend drier into mid-March.

Economy:
Donald Trump’s top economic adviser said he’ll meet regularly with Fed Chair Jay Powell to exchange views about the US economy, giving the president a channel to convey his opinions to the central bank, per Bloomberg.
82.8% of homeowners have rates below 6%, fueling the “lock-in effect” where homeowners avoid selling due to higher current rates. Below is a chart of pending homes sales, showing they have fallen to new all-time lows.

US Credit Card debt has hit a record of $1.2 trillion:

Something That Probably Means Nothing:
Back in the 1980s and 1990s, over 80% of girls and 75% of boys hung out with friends at least twice a week. Fast forward to today?
That number has crashed below 55%, and it’s still falling.
The steepest drop came after 2010, right when smartphones, social media, and binge-watching took over.
Instead of going out, teens are glued to TikTok, gaming alone, or texting from their bedrooms.
By 2020, teen socialization hit record lows, with both boys and girls seeing a sharp nosedive.

Quote of the Week:
“Never argue with an idiot. They will drag you down to their level and beat you with experience.” – Mark Twain